Authentication
Authentication is provided by Aeris.
You can directly log in if you have an :

The eduGAIN interfederation service connects identity federations around the world, simplifying access to content, services and resources for the global research and education community. More information.

ORCID is a free, unique, persistent identifier for individuals to use as they engage in research, scholarship, and innovation activities. More information.
If you don’t have the possibility to use these two solutions, you can use the register button to create a new account.
Data selection
- Search text area
- Combined criteria :
- dataset or inventory
- parametre / parametre group
- sector / sector group
- geographical coverage and grid resolution
- Navigation path


Chart options

Data Values on hover


Map display
Navigation options
- Overview map
- Full screen
- Zoom
- mouse wheel
- button +/-
- horizontal scroll bar

- Grid min = minimum value over zero
- Scale range = minimum value is set to a factor e-10 of the maximum value
Zoom on region
- Select a region

Display options
- 10 Color palettes
- Number of colors (10,20 and 250)
- Scales :
- logarithm stretching or linear
- range min and max :
- automatic (default)
- manual


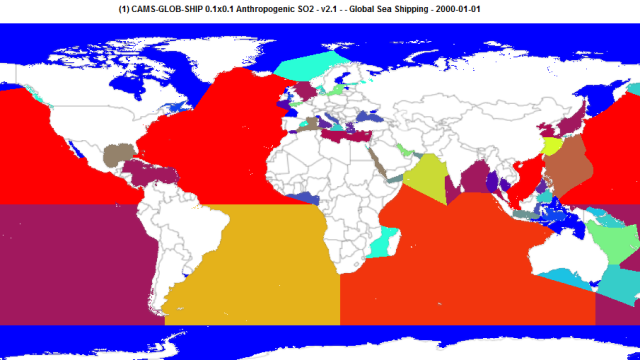
Regional masks
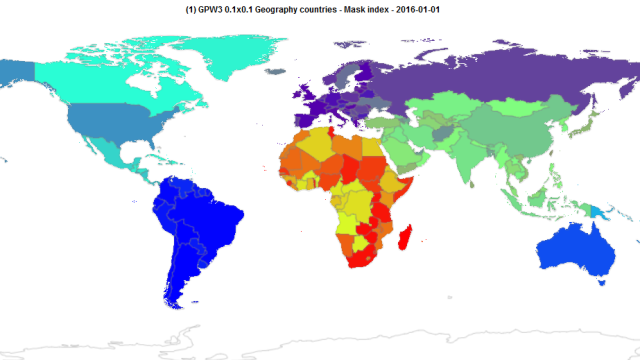
- Countries & continents
- World (10 representativ countries)
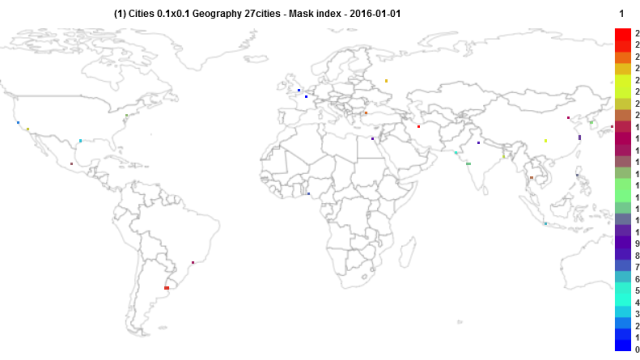
- Cities (27 megacities)
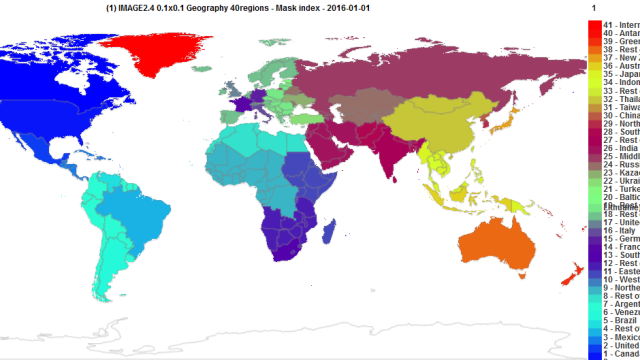
- IMAGE2.5 26 regions
- IMAGE2.5 40 regions
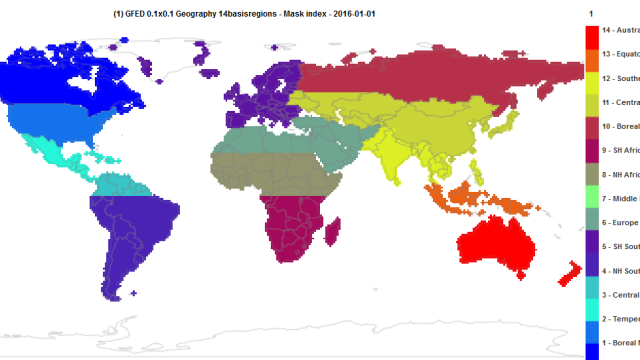
- GFED regions (14 geoclimatic regions)
Map Compare
Grid combination
- Arithmetic combination between 2 grids :
- difference (1) – (2)
- sum (1) + (2)
- normalized difference (1) – (2) / (2)


Scatter plot


Time Series on the fly
At any location

Over a region
- Choose region


- Press Time series icon


Time series
All sectors


All regions

Campare time series
All species for selected dataset

One species from all selected datasets

Pie chart all sectors
Download
- NetCDF files, CSV files global and regional (6 regional masks) analysis
Instructions for wget
1- Open the email message you received entitled ‘[ECCAD] Download from …’
2- Copy the File Name (5th line)
3- Copy the download link (URL address)
- right-click on

- option ‘Copy the URL address’
- URL_address =
- right-click and paste
4- Open a Terminal and write the following command
wget --no-check-certificate -c -t 0 --timeout=60 --waitretry=300 -O CEDS_Glb_0.5x0.5_anthro_NOx_.zip https://service...
